MNE / Python: Photodiode trigger-display lag pipeline
Lead authors: Gayathri Satheesh gs2750@nyu.edu, Hadi Zaatiti hadi.zaatiti@nyu.edu
This notebook measures, on the KIT system, the delay between the MEG trigger and the moment a visual stimulus is actually shown on (a) the stimulus-computer monitor and (b) the PROPixx projector in the MSR. The projector is the ground truth for when the participant sees the stimulus, so its lag is the number to correct MEG events by.
The experiment that produced the data is described on the Photodiode experiment page. The MATLAB / FieldTrip version of this same analysis is here.
Analysis is rise-only: every lag is measured on the rising (black→white) edge of the trigger and of each screen. Falling edges are ignored.
Contributing
If you would like to contribute to this Python-based notebook see Contribution.
Importing data
The two recordings are hosted on NYU BOX; permissions are given upon request. Set an environment variable MEG_DATA to your Box Data folder, e.g. C:\Users\user_name\Box\MEG\Data. The two continuous KIT files are sub-photodiode_01.con and sub-photodiode_02.con (~1 GB each).
The swapped-sensitivity design
The photodiode box has one LOW-sensitivity channel and one HIGH-sensitivity channel, wired to fixed MEG channels. The two photodiode heads are swapped between the screens across the two recordings, so each screen is seen once by each channel:
MEG ch |
Sensitivity |
|
|
|---|---|---|---|
224 |
|
trigger |
trigger |
232 |
HIGH |
stimulus monitor |
projector |
233 |
LOW |
projector |
stimulus monitor |
In MNE these are MISC 001 (224), MISC 009 (232) and MISC 010 (233).
Step 1 - extract the three channels
The .con files are large, so we stream them once and cache the trigger and the two photodiode channels to a small .npz. Full script: extract_channels.py.
[ ]:
import mne, numpy as np, os

DATA = os.path.join(os.environ['MEG_DATA'], 'photo-diode')
KEEP = [224, 232, 233]           # trigger, HIGH-sens, LOW-sens

def extract(con):
    raw = mne.io.read_raw_kit(con, preload=False, verbose='error')
    sf, n = raw.info['sfreq'], raw.n_times
    misc = [i for i,t in enumerate(raw.get_channel_types()) if t in ('misc','stim')]
    out = {'sfreq': sf, 'n': n}
    for s in range(0, n, 500000):                 # block-stream, low RAM
        d = raw.get_data(picks=misc, start=s, stop=min(s+500000, n))
        for k in KEEP:
            out.setdefault(f'ch{k}', np.empty(n, np.float32))[s:s+d.shape[1]] = d[misc.index(k)]
    return out

z01 = extract(os.path.join(DATA, 'sub-photodiode_01.con'))
z02 = extract(os.path.join(DATA, 'sub-photodiode_02.con'))
print('sfreq', z01['sfreq'], 'Hz ; durations',
      round(z01['n']/z01['sfreq']), round(z02['n']/z02['sfreq']), 's')
sfreq 1000.0 Hz ; durations 2015 2490 s
Step 2 - what the signals look like
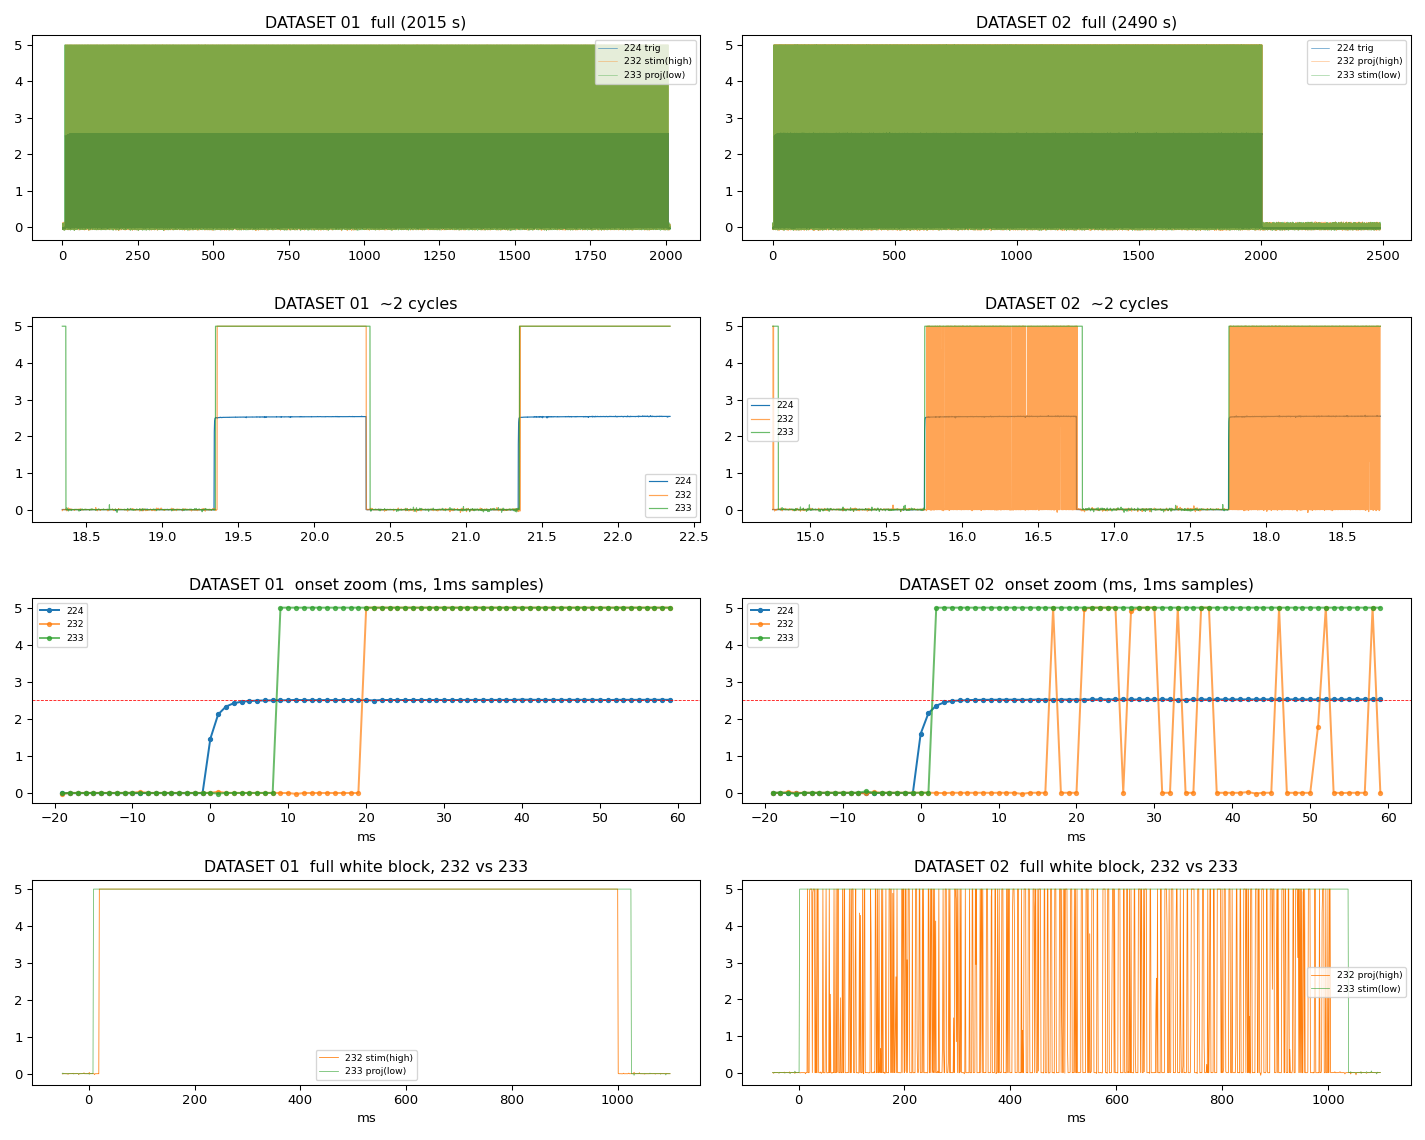
The low-sensitivity channel is a clean 1 s boxcar. The high-sensitivity channel on the projector resolves the DLP pulse train - during the 1 s white block it is a dense burst of ~1-4 ms pulses (~171 per block), not a boxcar. That is why the high-sensitivity channel is a poor onset detector.
[ ]:
import matplotlib.pyplot as plt
# overview: full record, one cycle, onset zoom, and the full white block per dataset
# (see analyse_photodiode.py for the plotting code)
Step 3 - rise-only edge detection
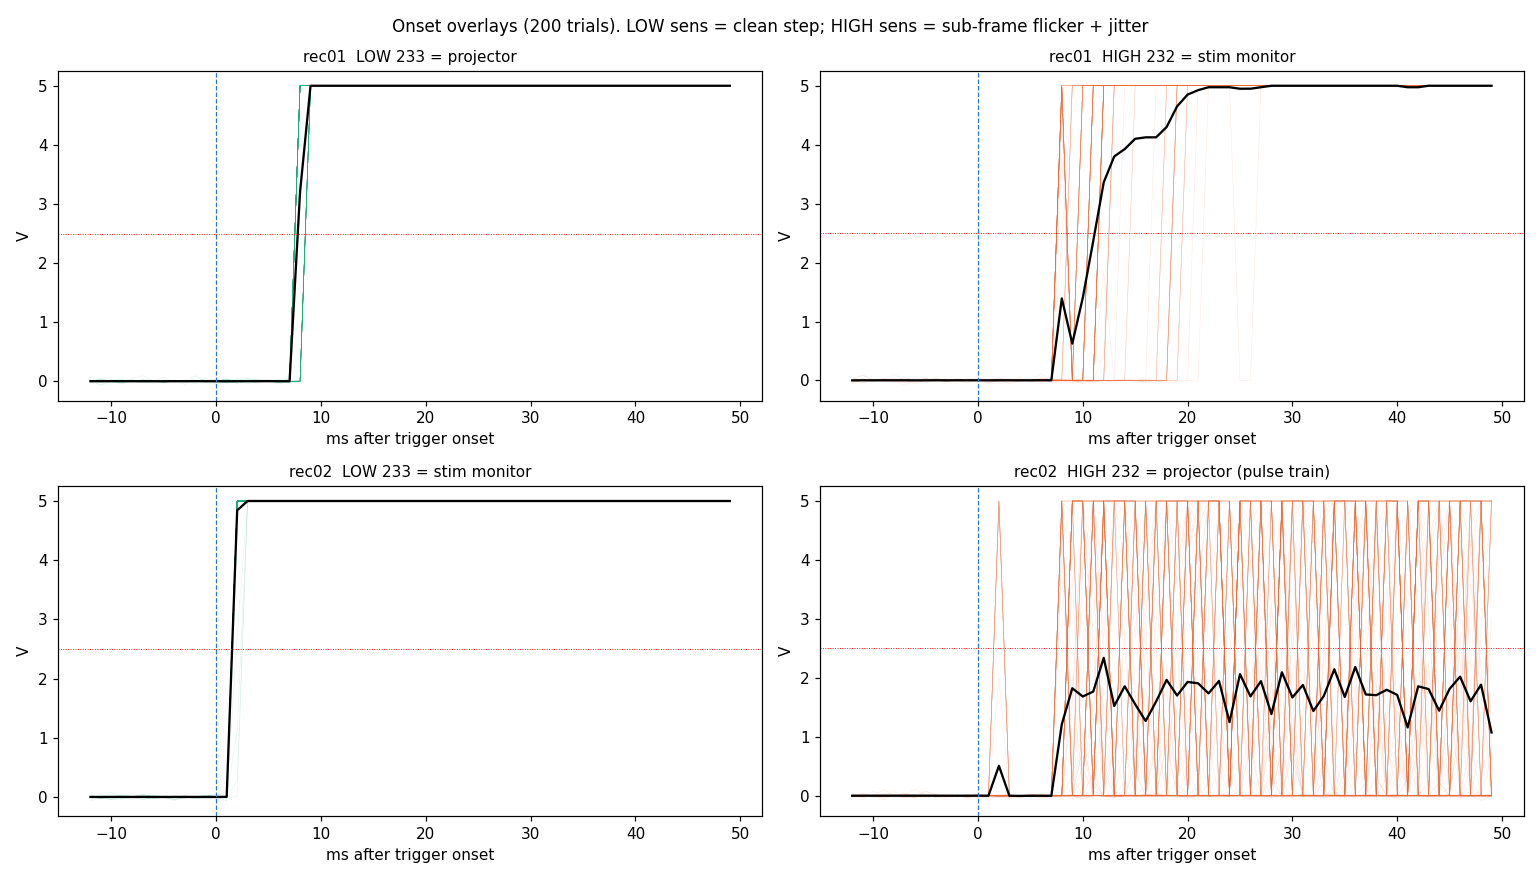
Rising edges are detected at 50 % of each channel’s own [1st, 99th] percentile range, with a 0.5 s refractory. For the projector on the high-sensitivity channel the pulse train is first morphologically closed so the whole white window becomes one block and its leading edge (the first projector photons) is returned. Full helpers: photodiode_lib.py.
[ ]:
def rising_edges(x, sf, frac=0.5, refractory_s=0.5):
    lo, hi = np.percentile(x, [1, 99])
    above = x > lo + frac*(hi-lo)
    cand = np.flatnonzero(above[1:] & ~above[:-1]) + 1
    keep = [cand[0]]
    for i in cand[1:]:
        if (i-keep[-1])/sf > refractory_s: keep.append(i)
    return np.asarray(keep, int)

def pair_lag_ms(a, b, sf, tol_s=0.15):
    return np.array([(b[np.argmin(np.abs(b-i))]-i)/sf*1000 for i in a
                     if abs(b[np.argmin(np.abs(b-i))]-i)/sf <= tol_s])
Overlaying 200 trials aligned to the trigger makes the difference obvious: the LOW-sensitivity channel is a clean single-sample step; the HIGH-sensitivity channel is smeared by sub-frame flicker and jitter.
[ ]:
# onset overlays, low vs high sensitivity, both datasets
Step 4 - the lags
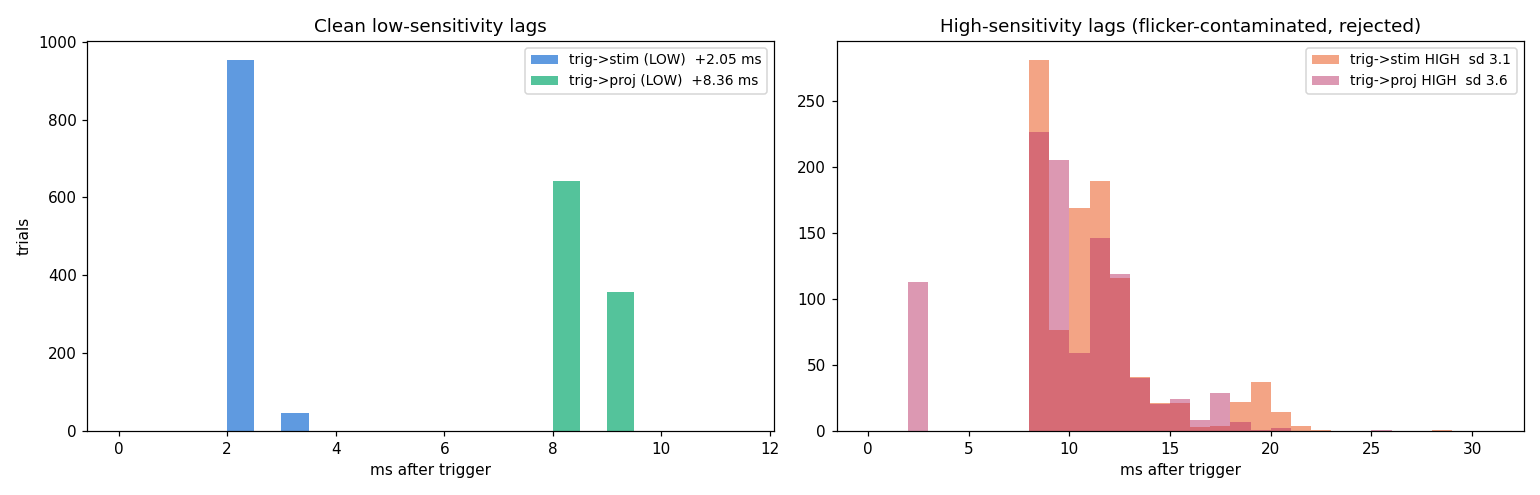
Using the clean low-sensitivity channel for both screens (projector in _01, stimulus monitor in _02):
[ ]:
# trig->screen lag, low-sensitivity channel, both datasets (rise-only)
trig01 = rising_edges(z01['ch224'], sf)
proj   = pair_lag_ms(trig01, rising_edges(z01['ch233'], sf), sf)  # _01 low = projector
trig02 = rising_edges(z02['ch224'], sf)
stim   = pair_lag_ms(trig02, rising_edges(z02['ch233'], sf), sf)  # _02 low = stimulus
print(f'trigger -> stimulus : {stim.mean():+.3f} ms  (sd {stim.std(ddof=1):.3f})')
print(f'trigger -> projector: {proj.mean():+.3f} ms  (sd {proj.std(ddof=1):.3f})')
print(f'stimulus -> projector: {proj.mean()-stim.mean():+.3f} ms')
trigger -> stimulus : +2.046 ms  (sd 0.210)
trigger -> projector: +8.358 ms  (sd 0.480)
stimulus -> projector: +6.312 ms
[ ]:
# distributions
Headline
Lag (rising edge) |
Value |
SD |
n |
|---|---|---|---|
trigger 224 → stimulus monitor |
+2.05 ms |
0.21 |
1000 |
trigger 224 → projector |
+8.36 ms |
0.48 |
1000 |
stimulus monitor → projector |
+6.31 ms |
1000 |
Both onsets are stable across the session and essentially jitter-free (the sub-ms SDs are 1 kHz quantisation), so a constant correction is exact.
Step 5 - verification
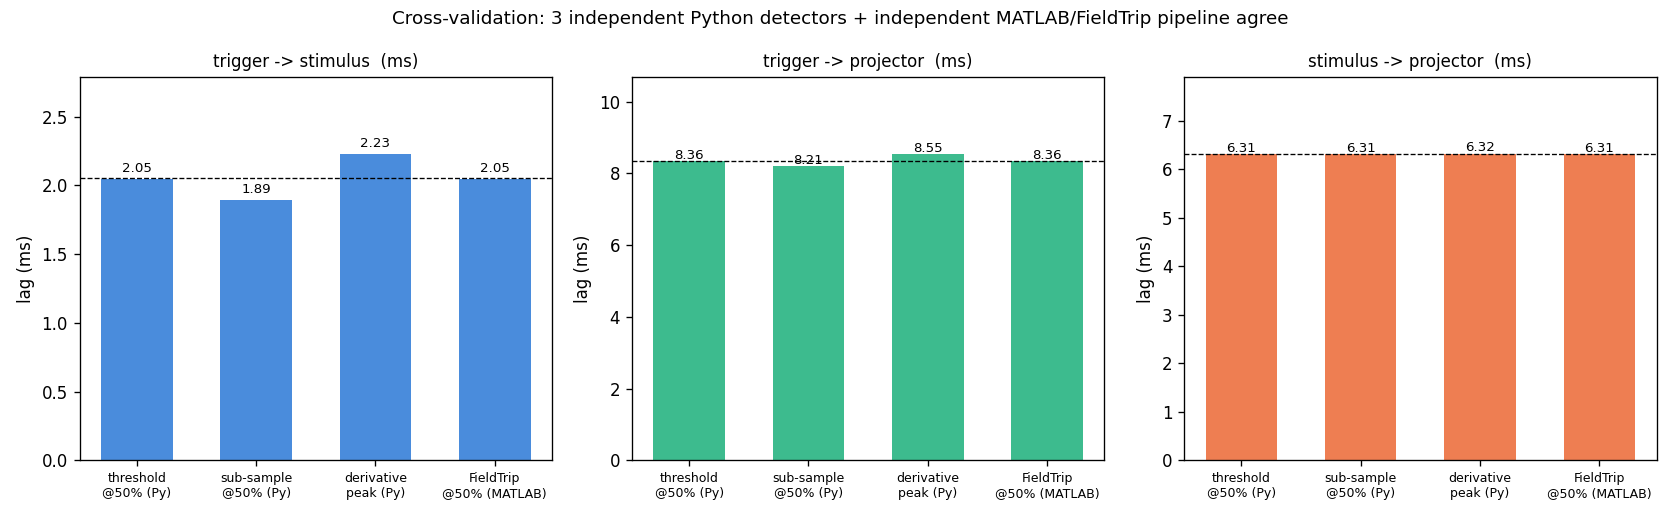
The numbers were cross-checked with three independent Python detectors (threshold, sub-sample interpolation, derivative-peak) and an independent MATLAB / FieldTrip pipeline. All agree, and stimulus→projector = 6.31 ms in every method (it is independent of the trigger criterion because both onsets share the trigger reference).
[ ]:
# 4-method cross-validation
Step 6 - correcting MEG events
The projector is the ground truth for stimulus visibility, and the trigger precedes it by a stable +8.36 ms. Shift events later by that amount before epoching. Full helper: apply_correction.py.
[ ]:
from apply_correction import correct_events, PROJECTOR_MS   # 8.36 ms

raw = mne.io.read_raw_kit('sub-XX_task.con', preload=True)
events = mne.find_events(raw, stim_channel='MISC 001')          # trigger 224
events = correct_events(events, raw.info['sfreq'], PROJECTOR_MS) # shift +8.36 ms
epochs = mne.Epochs(raw, events, tmin=-0.2, tmax=0.8, baseline=(None, 0))
Notes
+8.36 ms is the correction for a stimulus at the top of the screen (where the photodiode patch sits). A stimulus lower down is seen later by the raster scan time to that row; put the patch at the height you care about, or record a projector photodiode live for per-trial correction.
The ~6 ms projector-minus-monitor gap is the PROPixx DLP pipeline latency; the ~2 ms is the monitor’s response + input lag. Neither is reducible in the PsychToolbox code.