Photodiode: measuring trigger to display lag
Purpose
A trigger sent from the stimulus computer marks when a frame starts to scan out, not when the participant sees it. This experiment uses two photodiodes to measure that gap on the KIT system: the delay between the MEG trigger and the actual light on (a) the stimulus-computer monitor and (b) the PROPixx projector in the MSR. The projector is the ground truth for stimulus visibility, so its lag is the constant that should be subtracted from MEG trigger times before epoching when millisecond precision matters.
Authors: Gayathri Satheesh <gs2750@nyu.edu>, Hadi Zaatiti <hadi.zaatiti@nyu.edu>
How the experiment works
The PsychToolbox script alternates a 250x250 px patch between white and black at the top of the screen, 1 s each, for 1000 trials. Two markers are written into the same frame:
a 1x1 top-left trigger pixel, read by the VPixx DataPixx in pixel mode and converted to the MEG trigger on channel 224;
the photodiode patch at the top of the screen, watched by a photodiode.
The trigger pixel is held to its “on” colour for the whole 1 s white phase, so
the rising edge of channel 224 marks white onset. Because the patch is at the
top of the screen (scanned first) it is temporally co-located with the trigger
pixel, and both are drawn in the same Screen('flip') (no off-by-one-frame
error).
The signal chain
The DataPixx is the hub. The stimulus computer’s video goes into it; from there (a) pixel mode emits the trigger to the MEG DAQ, and (b) the video is forwarded to the PROPixx projector in the MSR. A console monitor shows the same frame. The trigger is therefore born at the very start of frame scan-out, and every photon the photodiodes see happens downstream of that moment.
The photodiode box and the two recordings
The photodiode box has a LOW-sensitivity channel (CH1, knob ADJ1) wired to
MEG 233 and a HIGH-sensitivity channel (CH2, knob ADJ2) wired to MEG
232. The activation threshold sat around 10 at the 0 outer setting;
both knobs were set a little beyond that for margin. Two recordings were taken
with the photodiode heads swapped between the screens:
sub-photodiode_01: LOW/233 = projector, HIGH/232 = stimulus computer.sub-photodiode_02: LOW/233 = stimulus computer, HIGH/232 = projector. Here the high-sensitivity channel on the projector indexed the frame flip (a train of peaks within the white window) rather than a boxcar.
Both used 1000 trials. Swapping lets the clean low-sensitivity channel measure both screens; see Display and trigger timing for the full method and why the low-sensitivity channel is the one to trust.
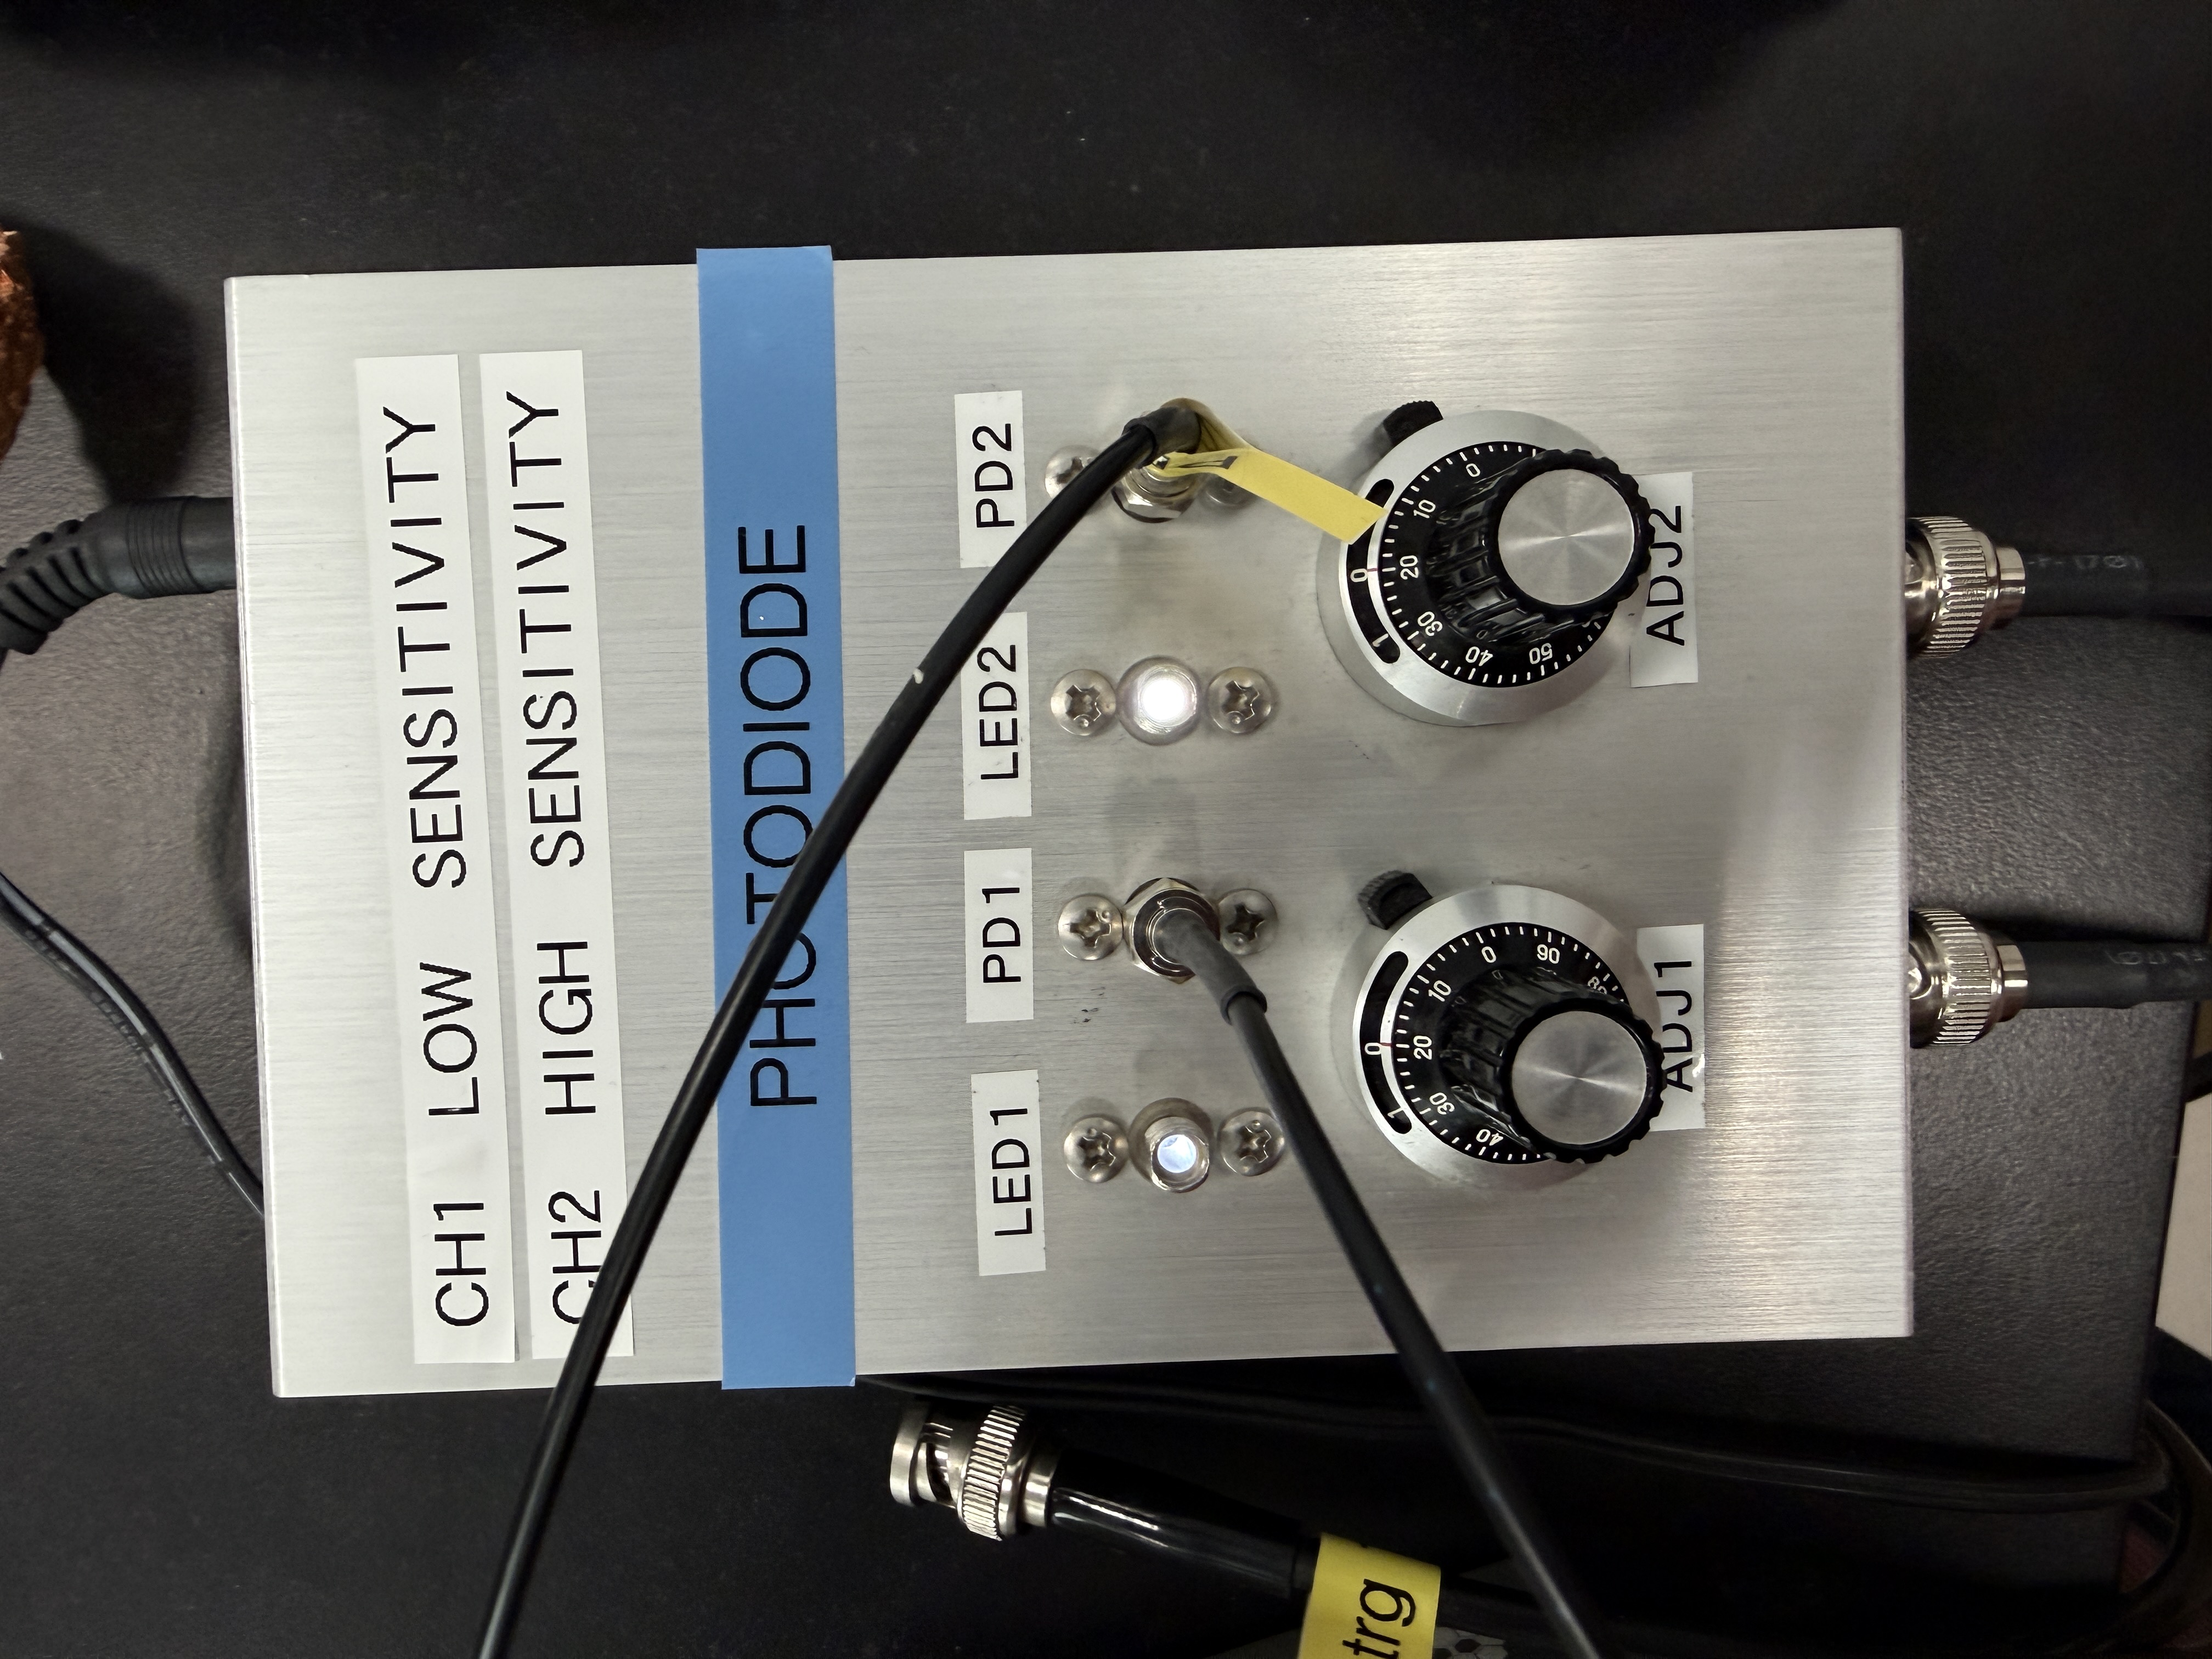
Photodiode box: CH1 LOW sensitivity (ADJ1) and CH2 HIGH sensitivity (ADJ2).
Results
Two recordings were taken with the photodiode box’s LOW- and HIGH-sensitivity channels swapped between the two screens, so the clean LOW-sensitivity channel measures both screens (rising-edge lags, 1000 trials each):
Lag (rising edge) |
Value |
SD |
n |
|---|---|---|---|
trigger 224 → stimulus monitor |
+2.05 ms |
0.21 |
1000 |
trigger 224 → projector |
+8.36 ms |
0.48 |
1000 |
stimulus monitor → projector |
+6.31 ms |
1000 |
The onsets are stable across the session and essentially jitter-free (sub-ms SDs are 1 kHz quantisation), so a constant +8.36 ms correction locks MEG events to stimulus visibility. This supersedes the earlier rough estimate of ~8.5 ms.
Why the lag exists
The lag is hardware, not code. The ~6 ms projector-minus-monitor gap is the PROPixx DLP pipeline latency (frame buffering plus micromirror sequencing); the ~2 ms trigger-to-monitor gap is the console monitor’s pixel response and input lag. The trigger is already emitted at the earliest deterministic point and the patch is optimally placed at the top of the screen, so no change to the PsychToolbox script reduces the true photon-arrival lag; the correct response is to measure it and correct for it.
Note
+8.36 ms is the correction for a stimulus at the top of the screen, where the photodiode patch sits. A stimulus lower on the screen is seen later by the raster scan time to that row (up to ~8 ms at the bottom). Place the photodiode patch at the height of the stimulus you care about, or record a projector photodiode live for per-trial correction.
Analysis pipelines
The system-level reference for these numbers is Display and trigger timing. The full, plotted analysis is provided in two independent implementations that agree to the last digit:
Experiment code
photodiode_test.m
%% Face Working Memory MEG (FWWM) Study
% 05/11/24: written  by Gayathri Satheesh (gayathri.s.satheesh@gmail.com)
% 30/07/26: edited by Gayathri Satheesh (gayathri.s.satheesh@gmail.com)

% The goal of this script is to do a sanity check on the time that it takes for a frame sent from the stimulus computer
% to be seen by the participant in the KIT machine
% Let us call this, the "stimulus to propixx lag" and denote it x (in ms)
% Another lag is the time for the stimulus comput5er to send a trigger to the KIT machine, denote this lag y (in ms)
% The photodiode can give us the ground truth on the KIT machine of when the visual stimulus indeed appeared, and help correct the y lag
% However the photodiode cannot tell us anything about the x lag (but we do not care about this one, because the brain reaction happens only after the person actually saw the stimulus)


% The idea is to use a photodiode that will capture changes in colors on a square turning from black to white
% the square is initially black after 500 ms it will turn white

% if we have a trigger indicating the white square sent from the stimulus computer to the KIT, then the photodiode can tell us the lag
% At the photodiode channel 233
% At the same time, when the square turns white, we will trigger channel 224 with a pulse
% We will check on the KIT data when the 224 trigger arrives and when the photodiode captures the white and measure that across multiple trials
% The monitor is at 120 Hz, we should see a frame every 8.333 ms, when we are showing a white square the photodiode is showing spikes
%   We can check that the spikes are happening every 8.333 ms, this confirms that the photodiode is sensitivie to the refresh equilibrate(
%

sca; clear ALL; %clean slate
%% --------------------------------------------------------------------- %%
%   experiment set-Up
%% --------------------------------------------------------------------- %%
ds.debug = 1;
% 1 for coding in laptop (skip synchronization tests)
% 0 for experiment in MEG (keep synchronization tests)

ds.usedatapixx = 1;
% 1 for datapixx open for trigger and response
% 0 for datapixx NOT open (no trigger, no vpixx response)

ds.little_window = 0;
% display little window in the same screen: 1 true, 0 false

trg.trigger_test = 0;
% if 0, trigger is 1 pixel (for exeriment),
% if 1 trigger is bigger (to be able to see it during debugging)

ds.Vpixx_response = 0;
% if 0, laptop keyboard responses (debugging)
% if 1, Vpixx response buttons
%% --------------------------------------------------------------------- %%
%   environment set-up
%% --------------------------------------------------------------------- %%
path_local = '/Users/wkc267/Documents/GitHub/FWMM_beh_meg';
path_local2 = '/Users/hannah/Documents/GitHub/FWMM_beh_meg';
path_meg = 'C:\Users\vpixx\Desktop\sreenivasan_lab\FWMM_beh_meg_gs';

%% --------------------------------------------------------------------- %%
%   disable pixel-mode
%% --------------------------------------------------------------------- %%

if ds.usedatapixx ==1
    Datapixx('Open')
    Datapixx('SetPropixxDlpSequenceProgram', 0)
    Datapixx('DisablePixelMode')
    Datapixx('RegWr')
end

%qq set project directory
if isfolder(path_local)
    PROJ_DIR = path_local;
elseif isfolder(path_local2)
    PROJ_DIR = path_local2;
elseif isfolder(path_meg)
    PROJ_DIR = path_meg;
else
    PROJ_DIR = pwd;
end

cd(PROJ_DIR);
addpath(genpath("imageTextures"),"taskmaps",genpath("scripts")) % add helper functions to path
expID = 'FWMM';
%get today's date
todayDate = datetime('now','Format','yyMMdd');
dateStr = string(todayDate);

%% --------------------------------------------------------------------- %%
%   display set-up / VPixx
%% --------------------------------------------------------------------- %%


%% -- set size and location of trigger pixel -- %%
baseRect_trigger = [0 0 1 1];
trg.centeredRect_trigger = CenterRectOnPointd(baseRect_trigger, 0.5, 0.5);

% initialize PTB and screen
ds = SetupDisplay(ds);
HideCursor(); %hide cursor

%initialize photodiode patch
baseRect_photoDiode = [0 0 250 250];
% Center the rectangle in the bottom-left corner
bottomLeftX = ds.width-25;  % X position, a bit in from the left edge
bottomLeftY = 05;  % Y position, adjusted from bottom of screen
trg.centeredRect_photoDiode = CenterRectOnPointd(baseRect_photoDiode, bottomLeftX, bottomLeftY);


% initiate kbcheck
kb = SetupKeyboard();

% baseline quit flag
exit_task = 0;
timeout = 0;

%% --------------------------------------------------------------------- %%
%   trigger start of experiment
%% --------------------------------------------------------------------- %%
key5 = [KbName('5%') KbName('5')];


% press the 5 key to trigger start of the experiment
key5down=0;
%draw grey background to the screen


%
% # TODO: The rule is:
%     # Everytime I use Background grey then Screen(ds.w, 'flip')
%         # I put just before this line, the top-left pixel to black to make sure that no incorrect triggers are there
%         # Now, if i want to trigger something:
%             # I prepare the graphics on the screen (ex: grey background) then I set the top-left pixel to the color of the trigger i want and only then, i flip
%                 # RIght after flipping, wait for a small amount of time that wouldn't ruin your trials, and then reput back whatever graphics you want, then set the top-left pixel to black, then flip
%% --------------------------------------------------------------------- %%
%   enable pixel mode
%% --------------------------------------------------------------------- %%

Screen('FillRect', ds.w, [0 0 0], trg.centeredRect_trigger);
Screen(ds.w,'flip');

if ds.usedatapixx == 1
  % Tell PTB we want to display on a DataPixx device
    Datapixx('Open');
    Datapixx('EnablePixelMode'); % trigger pixel mode
    Datapixx('RegWrRd'); % Synchronize DATAPixx registers to local register cache
end

trg.start=[0 80 0];
trg.noTrg= [0 0 0];
% specify fixation dot size
stim.fixSize_deg = 2; %2 deg? 1deg?
stim.fixSize_pix = ceil(Deg2Pix(stim.fixSize_deg,ds.viewDist,ds.res));

%% --------------------------------------------------------------------- %%
%   Start screen
%% --------------------------------------------------------------------- %%
%trigger task start
% Screen('FillRect', ds.w, trg.start, trg.centeredRect_trigger);
% ds.vbl = Screen(ds.w,'flip');
%draw grey background to the screen

while ~key5down
    Screen('FillRect', ds.w, ds.grey, ds.centeredRect);
    DrawFormattedText2('Experiment will start shortly...','win',ds.w, 'sx','center','sy','center','baseColor', ds.black,'xlayout','center','xalign','center','yalign','center');
    Screen('FillRect', ds.w, ds.black,trg.centeredRect_photoDiode);
    Screen('FillRect', ds.w, [0 0 0], trg.centeredRect_trigger);
    Screen(ds.w,'flip');
    [keyisdown, secs, keycode] = KbCheck(-1);
    key5down = keycode(key5);
end

    Screen('FillRect', ds.w, ds.grey, ds.centeredRect);
    Screen('FillRect', ds.w, ds.white,trg.centeredRect_photoDiode);
    Screen('FillRect', ds.w, [0 16 0], trg.centeredRect_trigger);
    Screen(ds.w,'flip');
    Screen('FillRect', ds.w, ds.grey, ds.centeredRect);
    Screen('FillRect', ds.w, ds.black,trg.centeredRect_photoDiode);
    Screen('FillRect', ds.w, [0 0 0], trg.centeredRect_trigger);
    Screen(ds.w,'flip');

%% --------------------------------------------------------------------- %%
%   present stimulus
%% --------------------------------------------------------------------- %%

WaitSecs(2);
numTrials=1000;
ds.vbl2 = GetSecs(); % Unit is seconds
ds.vbl = GetSecs();


for trial = 1:numTrials

        while ds.vbl2<ds.vbl+1

            Screen('DrawDots',ds.w,[ds.xCenter, ds.yCenter], stim.fixSize_pix, ds.black,[],1);
            % Channel 224 triggering
            Screen('FillRect', ds.w, [4 0 0], trg.centeredRect_trigger);
            % Square photodiode to white
            Screen('FillRect', ds.w, ds.white,trg.centeredRect_photoDiode);
            ds.vbl2 = Screen(ds.w,'flip');
        end

        while ds.vbl<ds.vbl2+1
            % trigger off

            Screen('DrawDots',ds.w,[ds.xCenter, ds.yCenter], stim.fixSize_pix, ds.black,[],1);
            Screen('FillRect', ds.w,[0 0 0], trg.centeredRect_trigger);
            % Square photodiode to black
            Screen('FillRect', ds.w, ds.black,trg.centeredRect_photoDiode);
            ds.vbl = Screen(ds.w,'flip');
        end

    %write to file

    % end of last trial screen
end


DrawFormattedText2('End of the experiment!','win',ds.w, 'sx','center','sy',ds.line2,'baseColor', ds.black,'xlayout','center','xalign','center','yalign','center');

Screen('FillRect', ds.w, trg.noTrg, trg.centeredRect_trigger);
Screen('FillRect', ds.w, ds.black,trg.centeredRect_photoDiode);
Screen(ds.w,'flip');


% press the 5 key to trigger start of the experiment
key5down=0;
ListenChar(0);% enable transmission of keypresses to Matlab
while ~key5down
    [keyisdown, secs, keycode] = KbCheck(-1);
    key5down = keycode(key5);
end

% VPixx clean up
if ds.usedatapixx
    Datapixx('DisablePixelMode');
    Datapixx('RegWr');
    Datapixx('Close');
end

ShowCursor();
sca